
Page 49 - Layout 1
P. 49
S T A T I S T I C S
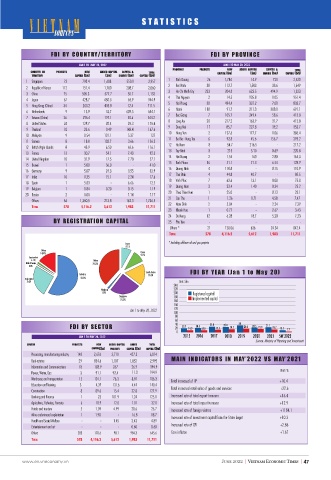
FDI BY COUNTRY/TERRITORY FDI BY PROVINCE
JAN 1 TO MAY 20, 2022 JAN 1 TO MAY 20, 2022
PROVINCE PROJECTS NEW ADDED CAPITAL CAPITAL & TOTAL
NEW
TOTAL
COUNTRY OR PROJECTS NEW ADDED CAPITAL CAPITAL & TOTAL PROVINCE PROJECTS CAPITAL ($M) PROJECTS SHARES ($M) CAPITAL ($M)
CHARTERTED
($M)
TERRITORY CAPITAL ($M) ($M) SHARES ($M) CAPITAL ($M) CAPITAL($M) CAPITAL($M) CAPITAL($M)
721
14.9
2,520
166
796.3
Minh
Chi
Ho
1Singapore 73 798.4 1,608 550.1 2,957 1 1 Binh Duong 26 1,784 4,976 35,711 12,984
City
2 Bac Ninh 38 112.7 1,503 33.6 1,649
2 Republic of Korea 112 151.4 1,700 208.7 2,060 2 Ba Ria - Vung Tau 4 76.3 298 26,579 7,512
494.9
7,906
2,815
115
62.7
Hanoi
3 China 75 505.3 577.7 50.7 1,133 3 3 Ho Chi Minh City 233 204.8 623.5 22,646 1,323
14.5
1.05
1,199
8,114
Dong Nai
4Japan 67 428.7 450.3 65.9 944.9 4 4 Thai Nguyen 37 2 334.9 935.8 19,303 951.4
7.01
Duong
Binh
250.2
2,414
44
6,950
5 Hong Kong (China) 34 263.2 435.8 12.4 711.5 5 5 Hai Phong 30 494.4 331.2 19,790 832.7
Ninh Thuan
34
12.0
873.1
271.6
6 Netherlands 9 15.9 18.7 609.5 644.1 6 6 Hanoi 118 2 91.7 211.3 388.1 691.1
58.6
413.8
53
Ha Tinh
1.0
7 Taiwan (China) 26 296.4 197.1 50.6 544.2 7 7 Bac Giang 7 1 105.7 249.4 10,613 3,663
31.7
2,810
Thanh
49
2.3
8 United States 34 129.7 20.4 25.3 175.4 8 8 Long An Hoa 20 2 217.2 163.9 10,104 412.8
39.2
-
Phu Yen
-
1,578
57
9 Thailand 10 23.6 0.49 143.4 167.6 9 9 Dong Nai 11 85.7 227.8 8,031 352.7
1.06
0.9
85
Quang Nam
10
1,263
10 Malaysia 9 0.54 131.1 5.37 137 10 Hung Yen 2 1 127.6 177.7 5,005 306.4
92.8
156.7
3,202
Hai Phong
11
417
11 Samoa 8 18.8 103.7 3.66 126.2 11 Ba Ria - Vung Tau 25 6 482.9 45.6 10,499 295.2
686.5
-
31
-
12 Quang Ngai
12British Virgin Islands 8 43.9 6.50 65.6 116.1 12 Ha Nam 8 54.7 216.5 4,001 - 217.2
0.69
215
An
13
1,697
529
Long
13 France 13 30.7 54.1 7.43 92.3 13 Tay Ninh 30 3 243.0 5.10 4,070 220.8
2.80
7.3
35
14United Kingdom 10 31.9 17.5 7.70 57.1 14 Hai Duong 2 1 1.54 160 2,923 164.3
1,254
14
Kien Giang
6.54
Da Nang
15
286
1,718
95.7
15Brunei 1 5.00 36.0 - 41.0 15 Binh Phuoc 16 6 51.1 71.3 3,946 128.9
0.15
522.5
Hue
10.5
Thien
Thua
16
16 Germany 9 5.07 24.3 3.55 32.9 16 Quang Ninh 4 4 110.8 78 - 2,271 110.9
44.8
85.5
303
Hai Duong
17
17India 10 0.25 15.1 2.24 17.6 17 Thai Binh 15 4 304.1 40.7 6,322 - 1,798
62.6
0.08
75.8
18
Vinh Phuc
183
18 Spain 1 5.83 - 6.66 12.5 18 Vinh Phuc 17 7 144.2 13.1 2,923 952.1
23.4
25.2
0.34
480
19
Bac Ninh
19 Belgium 1 0.84 0.20 0.15 1.19 19 Quang Nam 64 3 209.2 1.40 6,164 1,172
25.1
0.13
20
0.1
Khanh Hoa
20 Russia 2 0.03 - 1.14 1.17 20 Thua Thien Hue 1 1 25.0 88 - 1,027 310.6
4.50
1.26
7.47
21
107
Quang Ninh
Others 66 1,360.5 213.8 162.3 1,736.5 21 Can Tho 1 3 568.4 1.71 5,164 1,720
22 Nam Dinh 2 5.04 - 2.24 7.29
TOTAL 578 4,116.2 5,612 1,983 11,711 22 Binh Thuan 3 46.5 112 3,501 746.4
2.67
3.43
0.77
23 Khanh Hoa 23 1 134.2 296 - 2,536 950.5
23
Hung Yen
6.28
5.20
7.23
24 Da Nang 12 4 183.0 18.7 2,357 1,139
218
Tay Ninh
24
BY REGISTRATION CAPITAL 25 Phu Yen 1 - 0.5 - 65 - 782.2 - 703.3 -
25
Can Tho
Others *
21 128.06 636 24.34 842.4
Others * 87 892.0 1,3 22,3019,852T O T A L
578
TOTAL 2,178 4,116.2 5,612 1,983 11,711
16,433 238,386.9 81,075
203
Japan * Including offshore oil and gas projects
* Including offshore oil and gas projects
8.1%
Others
China
14.9% 9.7%
Construction
1.1% Others
Hotels & Tourism 39.2%
0.2%
South Korea FDI BY YEAR (Jan 1 to May 20)
Industry 17.6%
Real estates 58.2%
25.6% Unit: $bn
240
Malaysia 220
1.2% 200 Registered capital
Singapore 180
25.5% 160 Implemented capital
140
120
Jan 1 to May 20, 2022
100
80
60 38
FDI BY SECTOR 40 22.7 14.5 24.3 15.8 35.8 17.5 35.4 19.1 20.3 28.5 19.9 31.1 19.7 11.7 7.7
20
0
JAN 1 TO MAY 20, 2022 2015 2016 2017 2018 2019 2020 2021 5M’2022
Source: Ministry of Planning and Investment
SECTOR PROJECTS NEW ADDED CAPITAL ADDED TOTAL
CAPITAL ($M) PROJECTS CAPITAL ($M) CAPITAL ($M)
Processing, manufacturing industry 148 2,676 3,710 427.3 6,814
Real estates 29 834.6 1,107 1,052 2,995 MAIN INDICATORS IN MAY’2022 VS MAY’2021
Information and Communications 76 103.9 267 26.9 394.9
Power, Water, Gas 3 91.1 92.4 11.3 194.9 Unit: %
Warehouse and transportation 15 101.1 76.3 8.81 186.3 Total increased of IIP +10.4
Education and Training 3 4.39 131.6 4.44 140.4
Construction 8 89.6 15.4 22.8 127.9 Total increased retail sales of goods and services +22.6
Banking and Finance 1 22 101.9 1.24 125.1 Increased rate of total export turnover +16.4
Agriculture, Fisheries, Forestry 6 18.9 12.0 1.01 32.0 Increased rate of total import turnover +12.9
Hotels and tourism 5 1.09 4.99 20.6 26.7 Increased rate of foreign visitors +1184.1
Mine and minaral exploitation 1 1.98 - 16.8 18.7 Increased rate of investment capital from the State buget +10.3
Health and Social Welfare - - 1.45 3.43 4.89
Entertainment and art - - - 0.60 0.60 Increased rate of CPI +2.86
Others 283 170.6 90.1 984.3 645.6 Core inflaton +1.61
TOTAL 578 4,116.2 5,612 1,983 11,711
www.en.vneconomy.vn JUNE 2022 | VIETNAM ECONOMIC TIMES | 47