
Page 49 - Layout 1
P. 49
S T A T I S T I C S
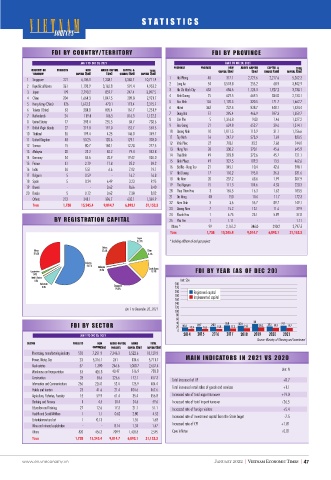
FDI BY COUNTRY/TERRITORY FDI BY PROVINCE
JAN 1 TO DEC 20, 2021 JAN 1 TO DEC 20, 2021
PROVINCE PROJECTS NEW ADDED CAPITAL CAPITAL & TOTAL
COUNTRY OR PROJECTS NEW ADDED CAPITAL CAPITAL & TOTAL PROVINCE PROJECTS CAPITAL ($M) PROJECTS SHARES ($M) CAPITAL ($M)
TOTAL
NEW
CHARTERTED
($M)
TERRITORY CAPITAL ($M) ($M) SHARES ($M) CAPITAL ($M) CAPITAL($M) CAPITAL($M) CAPITAL($M)
Phong
48
Ho
12,984
796.3
1Singapore 221 6,105.1 1,238.1 3,368.7 10,711.9 1 1 Hai Chi Minh City 166 317.1 2,727.6 2,217.6 5,262.2
4,976
35,711
2 Long An 54 3,518.8 255.2 68.9 3,842.9
2 Republic of Korea 361 1,198.9 3,162.8 591.4 4,953.2 2 Ba Ria - Vung Tau 4 76.3 298 26,579 7,512
7,906
22,646
115
62.7
2,815
Hanoi
3 Japan 199 2,790.2 859.7 247.4 3,897.5 3 3 Ho Chi Minh City 633 686.6 1,124.3 1,927.2 3,738.1
834.0
8,114
1,199
334.9
Dong Nai
37
4 China 204 1,664.3 1,047.5 209.8 2,921.7 4 4 Binh Duong 75 629.5 669.5 19,303 2,133.1
171.7
Duong
6,950
Binh
44
2,414
250.2
5 Hong Kong (China) 126 1,672.2 470.1 173.4 2,315.7 5 5 Bac Ninh 126 1,170.5 320.5 19,790 1,662.7
873.1
12.0
34
Ninh Thuan
271.6
6 Taiwan (China) 63 284.8 805.4 161.7 1,251.9 6 6 Hanoi 362 2 237.5 838.7 448.1 1,524.4
597.3
Tinh
3,663
1.0
Ha
53
7 Netherlands 24 119.4 186.5 816.3 1,122.3 7 7 Dong Nai 51 1 295.4 466.9 10,613 1,359.7
1.46
Thanh
49
2,810
2.3
8 United States 77 398.4 255.5 84.7 738.6 8 8 Can Tho Hoa 5 2 1,316.8 9.00 10,104 1,327.2
39.6
57
Yen
Phu
1,578
9 British Virgin Islands 27 219.8 197.0 152.7 569.5 9 9 Bac Giang 21 - 624.8 - 652.7 8,031 1,314.1
31.1
85
0.9
10
1,263
Quang Nam
10Thailand 35 199.4 4.25 146.0 349.7 10 Quang Ninh 10 1 1,011.5 113.9 5,005 1,156.6
1.69
Hai Phong
11
482.9
3,202
417
25
11 United Kingdom 48 53.25 120.6 129.1 303.0 11 Tay Ninh 16 247.9 573.9 10,499 823.5
7.68
31
-
-
12 Quang Ngai
686.5
12Samoa 15 80.7 184.1 12.78 277.5 12 Vinh Phuc 27 703.1 33.2 4,001 744.0
45.6
Long An
529
30
243.0
1,697
13
13 Malaysia 20 23.2 40.2 79.4 142.8 13 Hung Yen 28 330.2 270.1 4,070 645.9
45.7
7.3
1,254
35
14
Kien Giang
14 Germany 34 85.6 20.9 19.42 126.0 14 Thai Binh 49 1 393.8 272.6 2,923 721.1
13.5
Da Nang
1,718
15
95.7
286
15France 31 2.19 11.8 25.2 39.2 15 Binh Phuoc 49 6 327.5 109.3 3,946 462.6
42.6
78
16
10.5
522.5
Thua Thien Hue
16 India 26 5.51 6.6 7.02 19.1 16 Ba Ria - Vung Tau 21 4 345.1 10.4 2,271 398.1
26.3
303
304.1
17
1,798
15
Hai Duong
17 Belgium 5 0.59 - 16.2 16.8 17 Hai Duong 17 110.2 195.0 6,322 331.6
1.99
17
144.2
18
Vinh Phuc
183
952.1
18 Spain 5 0.24 6.49 3.23 9.95 18 Ha Nam 20 237.2 68.6 2,923 307.9
4.33
Bac Ninh
209.2
1,172
64
19
480
19 Brunei - - 0.62 8.66 8.40 19 Thai Nguyen 15 111.3 104.6 6,164 220.3
1.62
310.6
20
88
0.1
Khanh Hoa
20 Russia 5 0.12 0.62 7.38 8.12 20 Thua Thien Hue 3 1 165.5 16.3 1,027 183.5
1,720
107
Quang Ninh
21
3
568.4
5,164
Others 212 341.1 396.7 632.1 1,369.9 21 Da Nang 40 150 10.6 11.7 172.3
3.6
22 Nam Dinh 3 3 46.5 55.7 3,501 149.1
89.7
746.4
112
Binh Thuan
22
TOTAL 1,738 15,245.4 9,014.7 6,893.1 31,153.3
39.9
11.6
15.2
Nam
23 Quang Yen 23 7 134.2 13.1 2,536 950.5
296
23
Hung
24 Khanh Hoa 1 4 183.0 25.1 2,357 1,139
37.8
5.89
6.75
24
218
Tay Ninh
BY REGISTRATION CAPITAL 25 Phu Yen 1 1 1.11 65 - 782.2 - 703.3
1.11
25
Can Tho
0.5
Others * 99 2,161.2 346.0 290.2 2,797.5
Others * 87 892.0 1,3 22,3019,852T O T A L
1,738
TOTAL 2,178 15,245.4 9,014.7 6,893.1 31,153.3
203
16,433 238,386.9 81,075
Japan
12.5% * Including offshore oil and gas projects
* Including offshore oil and gas projects
Others
Others 27.6% China
31.6% 9.3%
Industry
58.1% Malaysia
0.4% South Korea FDI BY YEAR (AS OF DEC 20)
Construction 15.9%
1.4%
Hotels & Tourism
0.5% Unit: $bn
Real estates 240
8.4% Singapore 220
34.3%
200 Registered capital
180 Implemented capital
160
140
Jan 1 to December 20, 2021 120
100
80
60
40 35.8 35.4 38 31.1
FDI BY SECTOR 20 20.2 12.3 22.7 14.5 24.3 15.8 17.5 19.1 20.3 28.5 19.9 19.7
0
JAN 1 TO DEC 20, 2021 2014 2015 2016 2017 2018 2019 2020 2021
Source: Ministry of Planning and Investment
SECTOR PROJECTS NEW ADDED CAPITAL ADDED TOTAL
CAPITAL ($M) PROJECTS CAPITAL ($M) CAPITAL ($M)
Processing, manufacturing industry 533 7,251.9 7,346.3 3,522.6 18,120.9
Power, Water, Gas 23 5,316.1 261 134.6 5,711.7 MAIN INDICATORS IN 2021 VS 2020
Real estates 57 1,390 246.6 1,000.7 2,637.4
Warehouse and transportation 53 426.3 40.47 316.9 783.8 Unit: %
Construction 28 58.6 226.6 172.1 457.3 Total increased of IIP +8.7
Information and Communications 256 226.0 52.4 125.9 404.4
Hotels and tourism 23 41.6 21.4 104.6 167.6 Total increased retail sales of goods and services +1.1
Agriculture, Fisheries, Forestry 15 59.9 61.4 35.4 156.8 Increased rate of total export turnover +19.0
Banking and Finance 1 4.5 30.4 24.6 59.6 Increased rate of total import turnover +26.5
Education and Training 27 12.6 17.3 21.1 51.1 Increased rate of foreign visitors +5.4
Health and Social Welfare 1 1.1 0.62 2.80 4.52 Increased rate of investment capital from the State buget -7.5
Entertainment and art 1 0.13 - 1.55 1.68
Mine and minaral exploitation - - 0.14 1.34 1.47 Increased rate of CPI +1.81
Others 820 456.3 709.9 1,428.8 2,595 Core inflaton +0.81
TOTAL 1,738 15,245.4 9,014.7 6,893.1 31,153.3
www.en.vneconomy.vn JANUARY 2022 | VIETNAM ECONOMIC TIMES | 47