
Page 48 - Layout 1
P. 48
S T A T I S T I C S
RETAIL PRICE INDEX
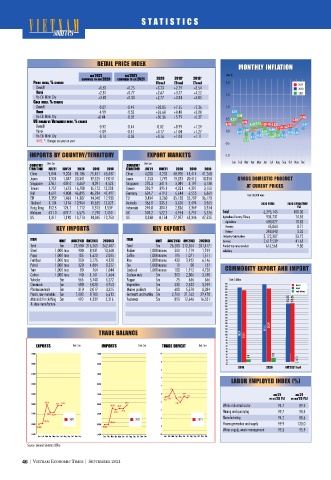
MONTHLY INFLATION
MONTHLY INFLATION
A AU AUG’2021’2021’2021GU G AU AUG’2021G’2021G ’2021 Unit: %
AU
2018*
2020
’2021
COMPARED TO AUG’2020 UATOD G ’2020 COMPARED TO JUL’2021JULTODARECOMP 2020 2019* *2019 2018*
’2021
COMPPA
ARERE
P
PRICE INDEX, % CHANGE DEXINRICE , % CHANGE (TOTAL) ) (T OT (T OT 2.0 2019
(T
(TOTAL))ALTA
OT TA
AL
(TOTAL))ALTA
2019
Overall
Overall +8.82 +0.25 +3.23 +2.79 +3.54 2020
+3.54
+8.82
+0.25
+2.79
+3.23
2020
+2.81
+0.77
Hanoi
Hanoi +2.81 +0.77 +2.67 +3.77 +4.22 1.5 2021
+4.22
+3.77
+2.67
2021
Ho Chi Minh City
Ho Chi Minh City +3.83 +0.33 +2.77 +3.84 +3.05
+3.05
+0.33
+3.84
+2.77
+3.83
G GOLD INDEX, % CHANGE CHANGEEXINOLD D , %
Overall -3.02 -0.49 +28.05 +7.55 +2.36 1.0
Overall
-0.49
+7.55
-3.02
+28.05
+2.36
Hanoi -4.99 -0.52 +26.68 +8.48 +2.80 0.76
Hanoi
+26.68
0.76
+8.48
-4.99
+2.80
-0.52
0.48
Ho Chi Minh City
Ho Chi Minh City +0.44 -0.05 +30.36 +5.79 +0.37 0.48 0.68
-0.05
+5.79
+0.37
+30.36
+0.44
0.68
0.27
US
US DOLLAR VS VIETNAMESE DONG, % CHANGEGDONAMESETNIE V , % GE 0.5 0.27 0.48 0.30
0.30 0
DOLLLA
ARR
, % CHAN
VS
0.48
0.07 0.15 0.133
30.16 0.23
0.07
Overall
Overall -0.92 -0.44 -0.02 +0.99 +1.29 0 0.30.30 0.07 0.15 0.130.16 0.23 0.13 0.16 0.15 0.07
0.15
-0.44
-0.02
-0.92
+0.99
+1.29
0
0.16
0.13
0.090090
-0.06.06 0.09
0 0.0
0
0 -0.06.
Hanoi -1.09 -0.41 +0.17 +1.04 +1.27 0.0 0.17 -0.06 60 060 060 0 0.09 0.07 0.0 0.07
Hanoi
+0.17
+1.27
-1.09
-0.41
+1.04
0.07
0.17
0
0.07 0.030.03
Ho Chi Minh City y -0.14 -0.05 +0.16 +1.01 +1.11 - -0.150.15 -0.03 0.07 -0.06- 0 -0.01 -0.0200.02 -0.02
0.07
-0.03
Ho Chi Minh City
+1.11
+0.16
+1.01
-0.14
-0.05
-0.06 -0.02-- 6
6
-0.12
NOTE: -0.12
NOTE: *: Changes are year on year*: Changes are year on year*: Changes are year on year
-0.5
IMPORTS BY COUNTRY/TERRITORY EXPORT MARKETS -1.0
Jan Feb Mar Apr May Jun Jul Aug Sep Oct Nov Dec
Unit: $m
Unit: $m
COUNTRY/Y/TRRY/
COUNTRY/Y/TRRY/
COUN Unit: $m COUN Unit: $m
TERRITORY YRY
2019
0
2018
TERRITORY
TERRITOR RY Y JUL’21JUL’21 38,464 2020 201922020 2019 2018 TERRITOR JUL’21JUL’21 JUN’21JUN’21 20202020 20192019 201820182018
JUN’21
JUN’21
9,844
65,437
4,020
75,451
41,268
41,268
China
84,186
China 9,844 9,203 84,186 75,451 65,437 China 4,020 4,233 48,905 41,414 41,268
48,905 41,414
China
4,233
9,203 84,186
1,793
1,753
Japan
18,850
1,924
20,341
19,283 20,412
19,525 19,010
Japan
1,847 20,341
Japan 1,924 1,847 20,341 19,525 19,010 Japan 1,753 1,793 19,283 20,412 18,850 GROSS DOMESTIC PRODUCT
18,850
378.1
3,138
3,138
4,091
3,049 3,197
341.9
Singapore
439.4
Singapore
Singapore 378.1 439.4 3,669 4,091 4,523 Singapore 270.3 341.9 3,049 3,197 3,138 AT CURENT PRICES
270.3
3,669
4,523
3,151
T
3,151
Taiwan 1,757 1,673 16,700 15,172 13,228 Taiwan 335.9 395.1 4,321 4,391 3,151
1,673 16,700
395.1
16,700
T Ta
335.9
1,757
15,172 13,228
aiwaniwan
4,391
4,321
aiwan
RoK 4,691 4,408 46,895 46,934 47,497 Ger many 604.7 619.5 6,644 6,555 6,869 Unit: BILLION
6,869
619.5
4,408 46,895
6,644 6,555
46,895
6,869
46,934 47,497
4,691
RoK
Germany
604.7
1,359
35,789
1,463 14,307
36,170
35,138
EU EU 1,359 1,463 14,307 14,048 12,930 EU EU 3,434 3,260 35,138 35,789 36,170 Unit: BILLION DONGSDONGS
3,434
14,048 12,930
3,260
36,170
14,307
Australia
3,965
3,965
335.5
10,964
11,655 12,023
366.0
3,620 3,494
Thailand
1,134
Thailand 1,134 1,176 10,964 11,655 12,023 Australia 366.0 335.5 3,620 3,494 3,965 2020 TOTALATTAL AL 2020 STRUCTURE EUCTUR020 STR
1,176 10,964
2
2020 TO
(%)
3,534
3,369
3,534
3,534
3,534
294.8 304.3
294.8 304.3
2,826
3,369
2,826
Hong Kong
Hong Kong
124,1
Indonesia
Indonesia
Hong Kong 152.5 124,1 1,112 1,313 1,539 Indonesia 294.8 304.3 2,826 3,369 3,534 (%)
1,112
1,313 1,539
1,313
124,1
1,539
1,112
152.5
152.5
100.00
6,293,145
6,293,145
5,776
697.7
4,954
6,575
503.2
522.2
7,290 7,450
Malaysia 631.0 697.7 6,575 7,290 7,450 UK UK 503.2 522.2 4,954 5,757 5,776 7RWDOODWR 7 7R 6,293,145 100.00
Malaysia
5,757
631.0
5,776
934,731
934,731
14.85
US US 1,311 1,190 13,713 14,365 12,753 US US 8,338 8,154 77,077 61,346 47,525 $JULFXOWXUH )RUHVWU\ )LVKHU\ \U HKVL) \UWVHUR) HUXWOXFLUJ$ 934,731 14.85
77,077 61,346
13,713
47,525
47,525
8,154
1,190 13,713
1,311
14,365
12,753
8,338
$JULFXOWXUHH UXWOXFLUJ$
680,827 10.82
10.82
680,827
680,827
45,064
KEY IMPORTS KEY EXPORTS 208,840 0.71
)RUHVWU\ \U WVHUR)
45,064
45,064
0.71
6.555.170.008
)LVKHU\\ UHKVL)
208,840
208,840
3.32
3.32
,QGXVWU\ &RQVWUXFWLRQ QRL WFWXUWVQR& \UWVXGQ, 2,122,307 33.72
33.72
2,122,307
2,122,307
ITEMMITE U UNITITN AUG’21(E) 8M’21(E)UG’21(EAUG’21(E ) 8M’21(E ) 2020(E))2020(E ITE U UNITITN AUG’21(E) 8M’21(E))8M’21(EUG’21(E)A 2020(E)2020(E)2020(E 6HUYLFHV V HFLYUH6 2,619,539 41.63
ITEMM
2,619,539 41.63
2,619,539
26,200 212,554
262,407
27,500
27,500 216,265
Totalotaltal
otal
281,417
Total $m $m 27,500 216,265 262,407 T To $m $m 26,200 212,554 281,417 3URGXFW WD[ PLQXV SURGXFW QLP[DWWFWXGRU 3 RUS V X W FW X G 616,568 9.80
T
281,417
9.80
616,568
616,568
Steel 1,000 tons 900 8,931 13,368 Rubber 1,000 tonnes 200 1,119 1,749 VXEVLGDU\ \U DGLVEX V
1,000 tons
13,368
1,000 tonnes
200
900
Steel
Rubber
1,749
1,749
1,119
8,931
1,511
Coffee
1,000 tonnes
1,511
2,035
1,071
1,620
Paper
Paper 1,000 tons 185 1,620 2,035 Coffee 1,000 tonnes 105 1,071 1,511
105
185
1,000 tons
3,175
430
Rice
1,000 tons
Fer tiliser 1,000 tons 350 3,175 4,120 Rice 1,000 tonnes 430 3,922 6,146
Fertiliser
1,000 tonnes
6,146
6,146
4,120
350
3,922
1,000 tons
Petrol
137
137
1,000 tonnes
320
Petrol 1,000 tons 320 4,884 8,227 Tea a Te 1,000 tonnes 10 10 80 80 137
4,884
8,227
4,720
1,912
100
4,720
1,000 tonnes
1,000 tons
Cr
Yarn nr Ya 1,000 tons 80 80 764 1,044 Crude oil 1,000 tonnes 100 1,912 4,720 COMMODITY EXPORT AND IMPORT
764
ude oil
1,044
3,188
3,188
3,188
3,188
Cashew nuts
2,306
2,306
Cashew nuts
Cashew nuts
1,000 tons
303
Cotton 1,000 tons 140 1,161 1,464 Cashew nuts $m $m $m 303 2,306 3,188
Cotton
Cotton
303
140
140
1,464
1,000 tons
1,464
1,161
1,161
566
6,272
666
Pepper
666
666
5,740
ehicles
Vehicles $m $m 566 5,740 6,272 Pepper $m $m 75 75 666 666 Unit: $ billion
V
Unit: $ billion
5,028
Chemicals
Chemicals $m $m 580 5,028 4,953 Vegetables $m 230 2,522 3,259 280 280 Import tmpor
3,259
3,259
egetables
580
$m 230 2,522
V
4,953
I
E
3,325
Pharmaceuticals $m $m 310 2,017 3,325 Marine products $m $m 600 5,578 8,384 270 270 260 260 Export txpor
8,384
8,384
310
5,578
600
Phar
Marine products
maceuticals
Marine products
2,017
rade balance
250 250 T Trade balance
8,100
8,100
6,613
29,478
29,478
Plastic raw materials
21,162
Plastic raw materials $m $m 1,003 6,613 Garments and textiles $m $m 2,700 21,162 29,478 240 240
2,700
ments and textiles
1,003
Garments and textiles
Materials for clothing $m $m 470 ,339 5,316 Footwear $m $m 850 12,646 16,551 230 230
5,316
Materials for clothing
16,551
16,551
470
Footwear
850 12,646
4,339
4,339
220 220
& shoe manufacture
& shoe manufacture 210 210
200 200
190 190
180 180
170 170
160 160
150 150
140 140
130 130
TRADE BALANCE 120 120 110 110 100 100
90 90
80 80 80
70 70
TRADE DEFICITRADE DEADE
EXPORTSTSXPORE Unit: $m I IMPORTSTSMPOR Unit: $m TR FICIT Unit: $m 60 60
Unit: $m
Unit: $m
Unit: $m
Unit: $m
Unit: $m
50 50
40 40
55000
55000 55000 10 10 30 30
55000
20 20
10 10
8 8 0 0
50000
50000
50000 50000 -10 -10
2020
2019019 2020 8M’2021 (EST))STE 8M’2021 (
2
6 6
45000 45000
45000
45000
4 4
LABOR EMPLOYED INDEX (%)
40000 40000
40000
40000
2 2
35000
35000 35000 0 0 AUG’21’21GAU A AUG’21’21GU
35000
V
VS
VS JUL’20 [%] JUL ’20 [%]JUL VS AUG’20 [%] UAS G ’20 [%]
-2 -2
30000
30000 30000 Whole industrial sector
Whole industrial sector
30000
Whole industrial sector
94.7
89.4
89.4
94.7
94.7 89.4
-4 -4
98.4
Mining and quarrying
99.7
Mining and quar r ying 99.7 98.4
25000
25000
25000
25000
Manufacturing
88.6
94.2
2021
2021
2021 2021 -6 -6 2021 Manufacturing 94.2 88.6
2021
Power generation and supply
99.9
120.0
20000 20000 Power generation and supply 99.9 120.0
20000
20000
-8 -8
, waste management
ater supply
Water supply, waste management 99.3 95.9
W
99.3
95.9
15000
15000 15000 -10 -10
15000
Sep
Sep
JanJan FebFeb MarMar AprApr MayMay JunJun JulJul AugAug SepSep OctOct NovNovNov DecDec Jan Jan Feb Feb Mar Mar AprApr MayMay Jun Jun Jul Jul Aug Aug Sep OctOct NovNovNov DecDec JanJan FebFeb Mar Mar AprApr MayMay Jun Jun Jul Jul AugAug Sep OctOct NovNov Dec Dec
Source: General Statistics Office
Source: General Statistics Office
46 | VIETNAM ECONOMIC TIMES | SEPTEMBER 2021